Introduction to Predictive Analytics Anomaly Detection
Many of our manufacturing customers create devices that are comprised of various electronic components. They collect data from the various components as the device operates—for example, the component’s temperature, how much current is passing through the component, whether a given component is emitting and at what frequency, etc.
We developed a multi-step process to analyze this device data and built an anomaly detection system that could be used to identify failing device components in near-real time. is helping manufacturers increase productivity and avoid unwanted downtime with smart factory solutions and predictive maintenance.
Step One – Clustering
The goal of this step is to identify clusters of related data points. In our case, we used our knowledge of how the equipment works. Viewing the devices as finite-state machines, we were able to identify the different states that the device could be in. Then we assigned each data point to the corresponding state that the device was in when that data point was measured.
It may not always be possible to find natural data clusters using domain knowledge. In such cases, algorithms such as K-means clustering or K-nearest neighbors can be used to partition the data into sets of related data points.
Step Two – Analysis
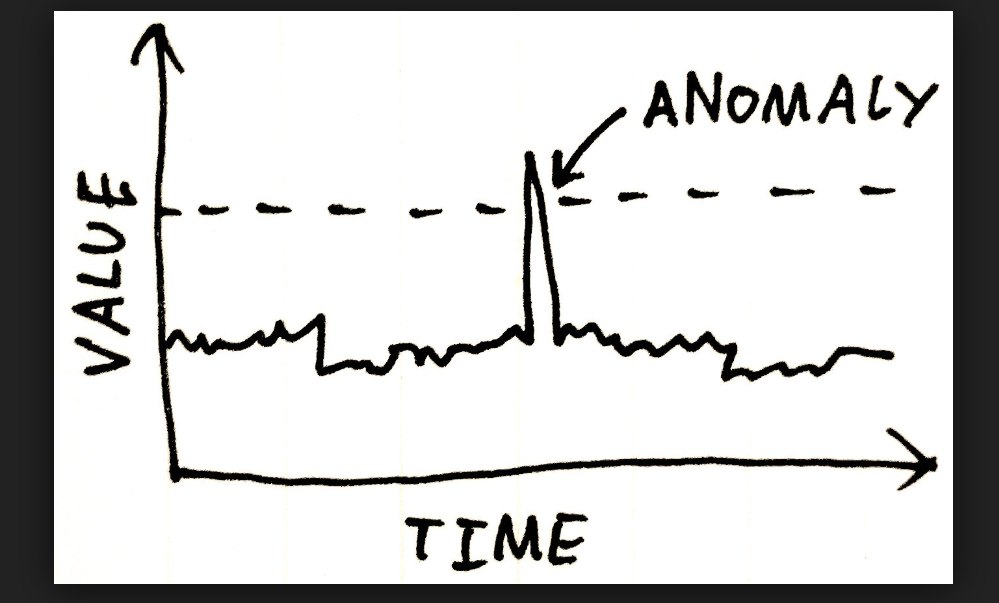
After clustering the data, the next step is to analyze each cluster. The goal is to compute a score for each data point and then use this score to identify the anomalous data points. The anomalous points will have scores that are either much higher or much lower than the rest of the data.
There are many scoring algorithms, but we chose to implement two: multivariate Gaussian and PCA Reconstruction Error. For the former, we assume that the data in each cluster has a Gaussian distribution (this is justified by the Central Limit Theorem), and we compute a Gaussian probability density function (PDF) for each data cluster based on a random sample of points. The score of a given data point is the value of the PDF at that point. Anomalous data points correspond to low PDF scores.
For the PCA Reconstruction Error, we perform Principal Component Analysis (PCA) on a random sample of points from each cluster to find a suitable lower-dimensional vector space that retains a certain amount of variance from the original data. Each data point (again, viewed as a multi-dimensional vector) is projected onto this lower-dimensional space using a linear transformation, then we reconstruct the data point using a corresponding inverse transformation. The reconstruction error is the Euclidean distance between the original data point and this reconstructed point, and this distance is the original point’s score. In this case, anomalous data points correspond to large score values.
Step Three – Thresholds
Now that we have a scoring model for each cluster, we need to set thresholds. Data points that exceed the threshold (either too low a PDF score or too high a reconstruction error) will be deemed anomalous. Generally, an anomaly detection system can produce both false positives – incorrectly identifying good data points as bad – and false negatives – misclassifying a bad data point as good data. We want to set thresholds that minimize false readings.
One way to do this is to use data points that are known beforehand to be either good or anomalous and computing scores for these points. We can then try a range of different thresholds and for each threshold, compute its F-1 score. This is a numerical value that relates false positives and false negatives. The thresholds with the highest F-1 scores will usually be the most effective ones.
Step Four – Ongoing Analysis
Having established our thresholds, we can now score device telemetry in real time. When a data point is presented, we determine which cluster it belongs to, then use the scoring model for that cluster to assign a score to the data point. If the score exceeds that cluster’s threshold values, we can send an alert to call someone’s attention to the data point..
Stratus Innovations Group: Innovative Solutions for Manufacturers and Businesses
Stratus Innovations Group’s Intelligent Factory Solution Offering is a powerful tool that can give you deeper insight into your equipment’s health and provide the predictive analytics for early-warning device failure. More importantly, it can communicate with machinery across a wide variety of platforms and protocols to increase safety and efficiency while mitigating downtime.
If you’re ready to learn more about preventive maintenance, pay-per-use equipment, and smart factory technology, please contact us today by calling 844-561-6721 or completing this brief online form.
The content provided here is for informational purposes only and should not be construed as legal advice on any subject.